The first step of the Kanban approach is mapping the value chain of the organization (or of the team, depending at which level the approach is focusing). The process should be mapped “as it is”.
At the starting point of the mapping process, particularly useful is the operating model canvas (that is part of the ISO 9001 system of BIT).
Operating model canvas
The operating model canvas represents graphically how the organization (or the team) delivers value to its customers or beneficiaries.
Fig 1 represents the highest level (helicopter view) of the operating model canvas of BIT service team in which the template is conform to the indication of Andrew Campbell.
In BIT, the most important use of this model is to align strategy (where the value proposition for the customer is defined) to
operations (how the value proposition is delivered by the organization).
This graphical tool was strongly sponsored by the new General Manager to facilitate the change in the Company.
The core of the canvas is the value delivery chain: a sequence of steps that describe the main work of the organization (or of the team); this is represented by section P of fig 1.
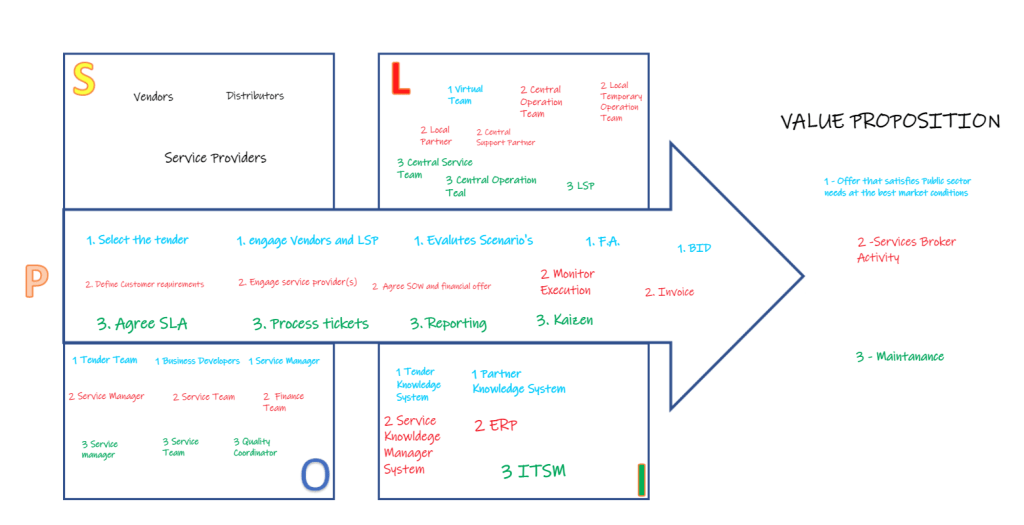
The service delivery model of fig 1 is a good starting point to map the process in the Kanban dashboard.
The representation of the value chain, in Kanban, is called workflow.
In fig 1, there are represented three workflows: the blue workflow represents the steps necessary to produce a (valuable) bid; the red one represents the steps necessary to produce a valuable broker service to the customer; the green workflow represents the steps necessary to produce value to the customer thorough an activity of maintenance.
To be compliant with the Kanban approach, for each flow it is necessary to decide where to start and to end the visualization process and in doing so, to define the interface points with upstream and downstream partners.
In Fig 2, the upstream of each flow is represented by the Backlog. For example, the backlog of the flow “Broker Professional Services” is made by the opportunities identified by the sales team (for the private sector) or the received Request for Offer (in the public sector).
The downstream of this flow is represented by the implemented (partially or totally) contracts that are ready to be invoiced (so the upstream partners are the colleagues of finance).
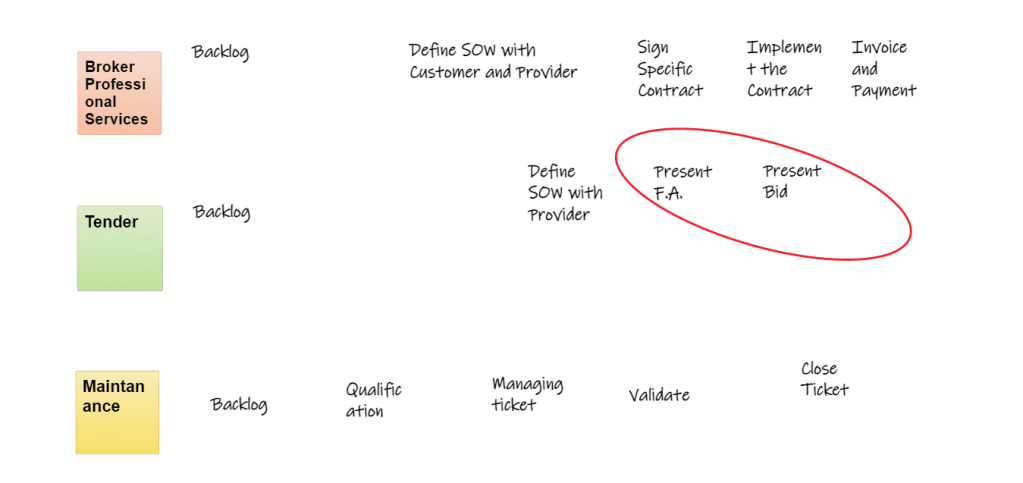
To avoid the complication of evaluating the size of work items (like it happens in Agile approaches), each step should ideally take about the same amount of time for each work item. If necessary, the flow is split into two (or more) clusters (in Kanban they are called swimlanes).
For this reason, BIT decided to split the flow “Broker professional Services” in Private and Public and the flow “Maintenance” in Standard and Critical.
Swimlanes are also used to visualize Continuous Improvement (in Kanban often called Kaizen) process of the workflow. However, in this first implementation, BIT decided not to do it.
The value chain is ready now to be visualized in a Kanban board.
In this way, BIT applies the first (of the six) Kanban practices: Visualize Work.
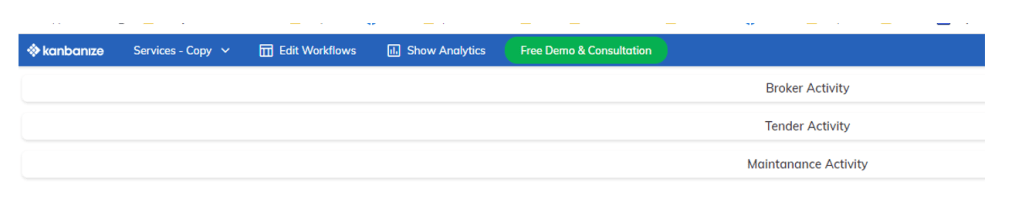
Covid Pandemic has made anachronistic the debate to have a physical or digital board. Inside BIT, the debate was to have a digital Kanban board using Atlassian solutions (as the service team already used Jira ITSM) or a dedicated Kanban solution. The influence of the consultant of BIT was quite decisive in the choice of Kanbanize.
One of the decisive argumentation in favor of Kanbanize is its ability to visualize the whole value chain of the (service) team and, when needed, to show the details of each flow. Fig 3 represents the (highest) view of the service team value chain
To know more:
Kanbanize board: introduce WIP limits.

