In the previous post I did my best to explain why the concept of statistical controlled process is important for the balanced scorecard measures.
In this post I wish to give a practical example of how the p-chart can be used as a “thermometer” to measure the health of a quoting process. I will also introduce another useful tool that might be used in a controlled process: The Capability Indices.
Verify statistical controlled processes with p-chart.
The p-chart shall be used for all measures that can take only two discrete value (ex. YES or NO, TRUE or FAULSE). For this reason, is a perfect “thermometer” for measure like KPI (the target is reached or not).
Let’s take again as an example the Performance Drivers of the Customer Perspective of BIT (Fig 1); in this case the manegement believes that to reach (at least) 90% of a tender KPI is ‘announcing’ that the customer will be satisfied of the performance of the Company.

Fig 1 -Balanced scorecard example
The p-chart will tell us if the current quoting process of BIT is in statistical control.
Fig 2 reports the 4 months (from September to December) results of the quoting process of BIT. You find hereby the data used to calculate the p-chart.

Fig 2 – p-chart of quoting process of BIT
The UCL is the upper control limit and the LCL is the lower control limit. Like in a thermometer, if the observation (in this case the percentage of orders in SLA (represented by the red line ) are within the two limits, the process has no “fever” (so it is in statistical control).
With the exception of week 12, the process is in control.
If you are interested to know how the UCL and LCL are calculated, I suggest the reading of the book “Statistical Process Control Demystified” of Paul Keller (Mc Graw Hill).
Capability Indices of a controlled process.
The PCL is the Centerline of the process.
Fig 3 reports the PCL for every week of the quoting process of BIT.

Fig 3 – p-chart with PCL
For example, in week 4 the PCL is 0.89. This means that after 4 weeks, 89% of the offers were in SLA (72/81). After 8 weeks 91% of the offers were in SLA (145/159).
Finally, after 16 weeks 87% of the offers were in SLA (352/404).
Knowing the process is in statistical control, can we say that the balanced scorecard target of the 90% has been reached?
To answer this question, we can use another useful tool of the statistical control methodology (for details I still refers to the book of Paul Keller): the Capability Index.
In order to use the Capability Index, it is necessary to verify that the process data are normal distributed. For a p-chart, it is not easy to verify this assumption.
An accepted “rule of the thumb” is to look at the expected quotes in SLA and the expected quotes out of SLA. Each of them shall be at least 10 (for a solid but not analytical explanation of this rule, I suggest to look the excellent videos of the Khan Academy dedicated to the Confidence Intervals of a binomial distribution – don’t forget in this case to leave a contribution -).
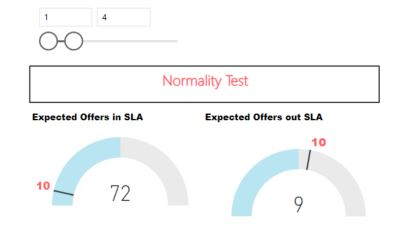
Fig 4 – Normality Test after 4 weeks
Fig 4 shows that after 4 weeks, there is not yet enough sample data to proceed with the calculation of the Capability Index.
Before proceeding further in the analysis of the capability indices, it is best practice to delete the observation of week 12 as this was the only week in which the process was not in control and this kind of analysis is quite sensitive to outliers.
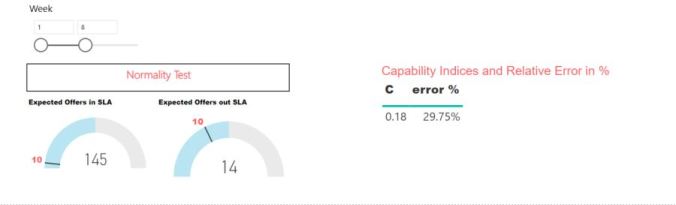
Fig 5 – Capability Indices after 8 weeks
Fig 5 shows that after 8 weeks the normality test assumption might be considered satisfied (remember, it is still a rule of thumb; it is a necessary but not sufficient condition for normality). In that case, we are authorised to use the Capability Index results. A capability indices of 0.18 is quite low; as you can see, there is about 30% probability that our process will not be able to respect the minimum target of 90% offers in SLA.
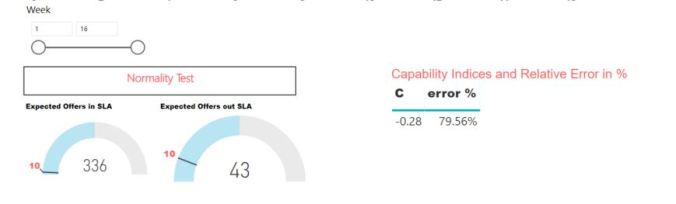
Fig 6 – Capability Indices after 16 weeks
After 16 weeks (remember that we have deleted week 12), the situation is even worst.
Fig 5 shows that the Capability Indices is negative. This means that the process cannot respect the minimum target (in fact we have practically 80% probability not to respect the target).
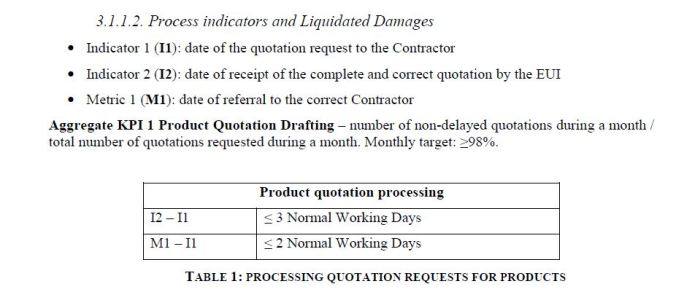
Importance of KPI measures in recent Public Tenders.
The recent tenders in the public sector are characterized by the increasing importance of KPI of the different processes. For example, this is KPI of the tender SIDE II of the European Commission for measuring the performance of the quote process:
Let’s insert the monthly target of 98% in the calculation of the error of the Capability Index of the quoting process of BIT (Fig 6) and load the new dataset in Power BI.

Fig 6 – New Minimun target
As expected, we have zero probability to respect the new minimum target (Fig 7).
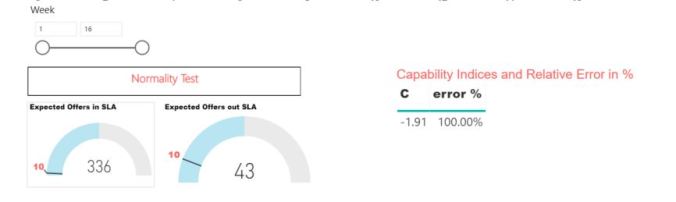
Fig 7 – Capability Indices with new minimun Target
No doubts that there is a lot of continuous improvement work to do on this process and BIT management must deeply reflect if the current balanced scorecard of 90% on the performance drivers is still appropriate.
Power BI as reporting tool for BIT.
BIT quality policy states that report that are shared inside or outside the organization must be realised through Power BI.
BIT believes that this tool helps to:
1) clarify to the stakeholder of the report the architecture of the data (and so increase credibility of the report itself);
2) Because Excel is a tool general accepted inside BIT organization, the employees can use (and personalise) the report made in power bi with very little effort.
Hereby the Power BI file created to manage the p-chart. If you are not familiar with DEX functions and you are interested to understand the function used in this file, I advise the study (a simple reading is not enough) of the book of Matt Allington “Superchage Power BI” (Holy Macro! Books).
To know more:
An intuitive presentation of statistical process control.

