In the post Balanced scorecard measures and statistical control charts I tried to link the concept of “control” with the concept of “diagnostic”.
In this post I wish to give an intuitive presentation of the statistical process control.
The statistical process control (SPC) was introduced by Walter A. Shewhart in the early 20 but it is only with W. Edwards Deming that become quite known to the quality practitioners. . It is a quite old tool but it is still very used in many modern continuous improvements approaches (for example six sigma).
The object of this (old) statistical tool is, of course, a process.
SPC: The Process.
In the majority of the QMS, the components of a process are the one described in Fig1.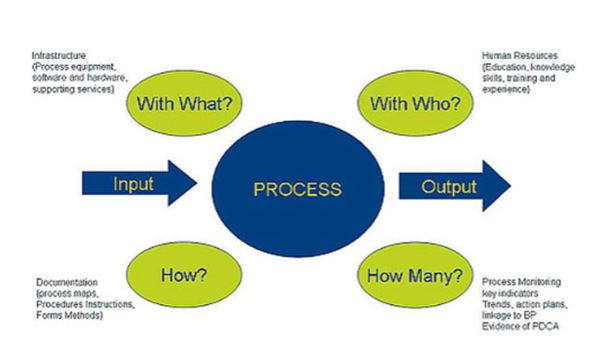
Fig 1 Process Components
The SPC focus on the specific component “How Many” – the measure of the output- .
The output can be a physical artifact or a service; it is easier, however, to use a physical artifact in an intuitive presentation. So, let suppose the input is an iron bar and that the output is iron clips.
The measure used in this process is the length of the clip (measured with a quite precise measuring gauge). In particular, every day a sample of 10.000 unit is taken and measured.
SPC: Statistic.
An old, but still powerful , way to represent (many) measures is the Histogram (so called by Karl Pearson in 1895). Fig 2 reports graphically the 10.000 measures of a particular day

Fig 2 – Histogram of Measures
From Fig 2 is quite straightforward to notice that the measures have a range that goes from (about) 2.97 to (about) 3.03. We can also notice that the majority of the measures tends to be close to 3. This “gravity” center is called mean. Another way to interpret the mean, is to think to a little gamble game; you have to bet one euro and guess the measure of the 10.001 clip. What would be your estimate?
In Fig 2 is also reported (as a blue dot) the distance of a measure from the mean. If you make an average of all the 10.000 measures, you obtain the so called standard deviation (often indicated with the Greek letter sigma σ).
The shape of the histogram of Fig 2 reminds the shape of a well-known (and used) statistical distribution: the Normal (or Bell) distribution (Fig 3).

Fig 3 – The Normal Distribution
When the measures of the process are represented by an histogram that has a shape close to a Normal distribution (like in Fig 4), it is empirically correct to estimate that there is a probability of 99.7 % that the measure will follow in an interval of six sigma (sound familiar ?) . In other word, when you define an interval of 6 sigma you should be “confident” to find a value of a measure generated by a normal distribution.

Fig 4 – Six Sigma interval
SPC: Control Chart
Are you still with me?
Following Shewhart’s teaching, let know introduce the time dimension on the horizontal axis like shown in Fig 5. You obtain in this way a so-called control chart.

Fig 5 – Control Chart
You have now the tool to judge if a measure (and so the related process) is in statistical control. If the measure is included in the upper and lower limit (the six-sigma interval), the process is in control (like for the two measures, represented by stars, from the left). Otherwise (like the 3rd star from the left), the process is out of control.
Following the teaching of Deming, a specific action is needed only when the process is out of control.
If you wish a more formal (but still practical) introduction to the statistical control process, I suggest the study of the book of Paul Keller: Statistical Process Control DeMYSTiFieD
To know more:
The Statistical Process control of the quality analysis of the tracking list.

