In the post Quality check of the tracking list it was presented a quite straitforward way to manage the quality of this control list. With the help of the statistical process control technique we can determine if the effort of the team have brought the process under control: a basic step to introduce then the continous improvement.
Identify and count the number of irregularity.
The easiest quantification we can introduce is the YES or NO check: there is an error or not in the monitored field.
The BIT service team decided to monitor only the red highlighted errors.
There is an operational problem to count the highlighted cells in red: they have an empty cell format (Fig 1).
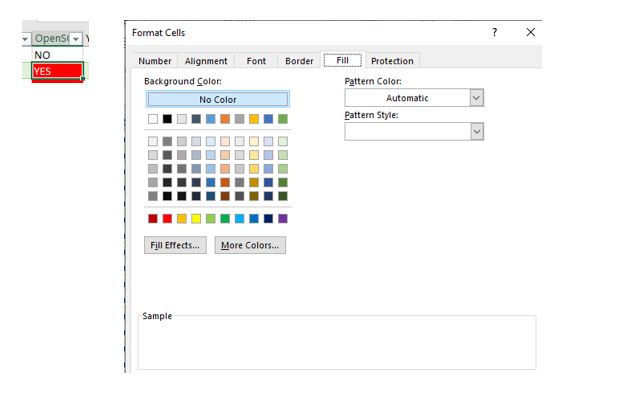
Fig 1 – The format of an highlited cell
In order to automatize the counting of highlighted red cell, the Quality coordinator of BIT has developed this simple (but effective) VBA macro (Fig 2):
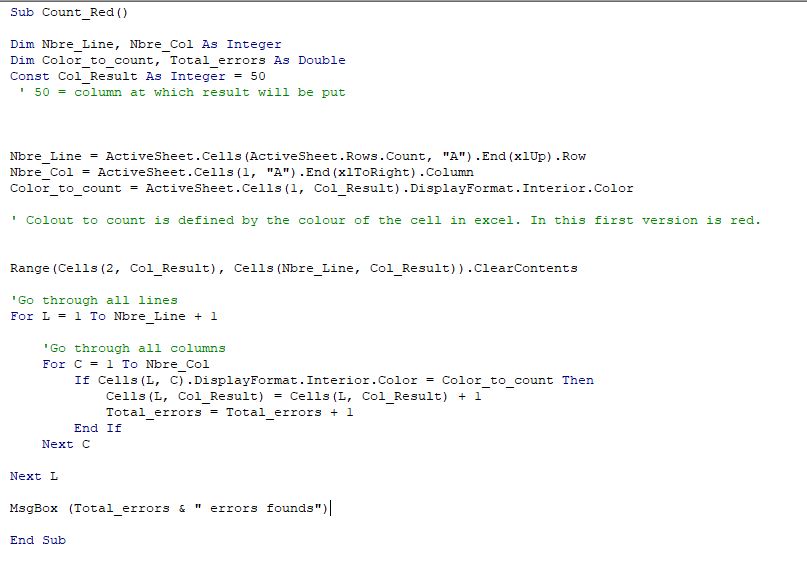
Fig 2 -VBA to count red errors
Using the above VBA script, is quite straightforward to collect, once a week, the necessary data for the Statistical Process Control (Fig 3).
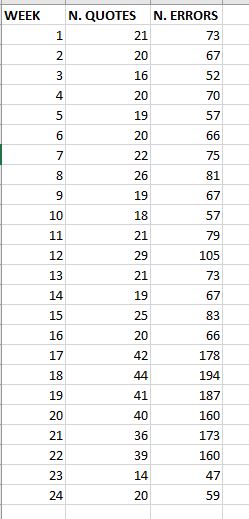
Fig 3 – data for SPC
BIT decided to introduce R (R studio, to be more precise) as a statistical tool to perform SPC as the quality coordinator had some knowledge of this language; of course, the gratuity of this powerful open source language helped a lot in the decision.
BIT installed the library “qcc” . In order to read the data file in excel, also the library “xlsx” has been installed.
In Fig 4 it is reported the batch code used by BIT to generate the statistical control chart of this process.
BIT decided to present the result of this (and other analysis) in power point. For this reason, the output of the analysis is a JPEG file (Fig 5).

Fig 4 – batch file for U-CHART
BIT decided not to use in their analysis the reported Number of violating runs but to focus on the more traditional component of the SPC (number of beyond limits and variability of the process) to verify if the process is in control.

Fig 5 – U-CHART of the process
Interpretation of the u-chart.
Except for week 21, the process is in statistical control. The root analysis performed in week 21 is out of scope of this post.
In average, the service team commits 3.75 mistakes for a single quote. Is this measure reasonable, too high, or too low? We cannot say. This is quality measure and it should be related to a performance measure to have a “business” mean (this is a key point in the balanced scorecard).
It is however possible to say that in BIT a service team of 24 week experience commits 3.75 mistake for quote in filling a checking list. This measure can become very useful to validate the effectiveness of future training methods.
The 3.75 is indeed an average; it is possible to identify (without using the number of violating run) that the process tends to be under this average in week 1-17 and then in week 23-24. On the contrary, the process tends to be over this average between week 17 and 22.
Looking at Fig 3 is quite evident that during the period between week 17 and 22 there are much more quotes to deal that in the other part of the year (this is quite typical in the public sector). This is causing an evident stress to the service team.
To know more:
Seasonality in Process Control: the business impact.

