The SPC of the quality analysis of the tracking list showed the presence of a strong seasonality in the process.
Statistically, it is possible to remove the seasonal effect but the quality coordinator of BIT prefers to separate the analysis of the process in “normal” and “high” period in order to give a business value to this quality measure.
The whole period.
In the interpretation of the u-chart it was noticed that the whole process is composed by a set of data above the average (here defined as “High Period”) and a set of data below the average (here defined as “Normal Period”).
It is always useful to have a plot of the whole period (Fig 1) in order to have a quick feeling of the process.
In Fig 2 is reported the R code to generate this simple plot (the two vertical lines have been added manually on the chart).


The normal period.
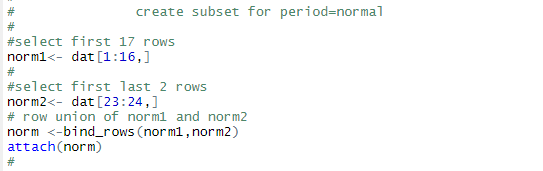
It is not difficult to use R Studio to create two subsets of data once the data (excel) file is imported as dat.
The normal period is composed by week 1 to week 16 and then by week 23 and 24.
You can use now the function describe(N..of.Quotes ) – library psych – to calculate the average number of quote of this period (20.56) and the standard deviation (3.45). So the coefficient of variation of the normal period is 0.168
It is now possible to use the library qcc to perform the SPC of the quality analysis of the tracking list in the normal period (Fig 4).

Notice that when the SPC is performed only the subset of data “normal period” there are not any more violating runs cases.
The high period.
In a similar way it is possible to create a subset for the so called “high period”.
The average of this period is 40.33 and standard deviation is 2.73. The coefficient of variation is 0.067.
So, the variability of the high period, in relation with his mean, is far less than the normal period.
It is now possible to use the library qcc to perform the SPC of the quality analysis of the tracking list in the high period (Fig 5) .
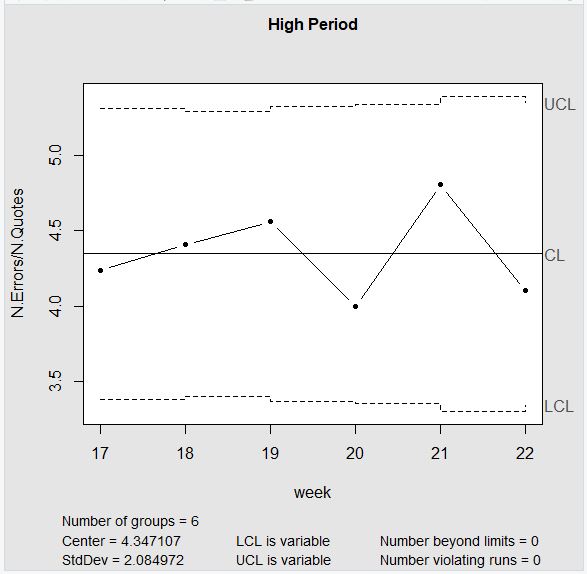
When the SPC is performed only on this subset of data, there are not any more observations out of control.
The Business Impact on seasonality.
Dividing the process in two segments- normal and high period – is appreciated by the customer service team leader as he can see more clearly how his process (the quality of the tracking list) is influenced by an external factor: the seasonality of the demand.
He wonders:
1) which objective of the BIT scorecard is impacted by seasonality (through his internal process);
2) how his internal process is impacted by seasonality.
The balanced scorecard helps to suggest how to link a quality measure such as the SPC of the quality analysis of the tracking list with the core business of the Company. More in details, it helps to build the cause-effect analysis.
The theory of the team leader is that:
a) HIGH PERIOD -> ↑ STRESS ON THE TRACKING LIST PROCESS -> ↑ BREAKING SLA -> ↑ LIQUIDATE DAMAGES
b) HIGH PERIOD -> ↑ STRESS ON THE TRACKING LIST PROCESS -> ↑ PROBABILITY OF BURN OUT -> ↑ ABSENTEEISM RATE
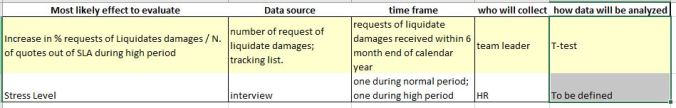
Following the best practice described in the QMS of BIT, he develops (with the support of the quality coordinator) the data collection plan of Fig 6.