After discussing with the team leaders and high management the 6 principles of the change management process of BIT, Paul was ready to design the different components of the process. It started with the reporting phase.
As to Project management reporting, Paul’s notes from discussion on the six principles:
– The reporting must be aligned with the balanced score card strategy;
– The reporting must be simple, to guarantee transparency to all employees. Better if it has a visual format;
– The report must be accessible on remote (Covid obliges);
– The report must involve finance. It is the only function that has a view of all current projects and their “political” support it is a must;
– Link with budget allocation (financial constrain);
– Highlights vertical (multi-function) projects;
– Flexible to consolidate status of projects with different approach.
From the Strategy Map to the Story Mapping.
In BIT, there was an acceptable understanding and use of the Story Mapping methodology and Paul decided to leverage this base to build the visual information representation of the project portfolio.
The first step was to translate the Strategy Map of the balanced scorecard of BIT (Fig 1) in the In the Goals sand Tasks of the Story Map (Fig 2 represents the translation of Financial and Customer Perspective).
Fig 1 – Strategy map of the balanced scorecard of BIT.
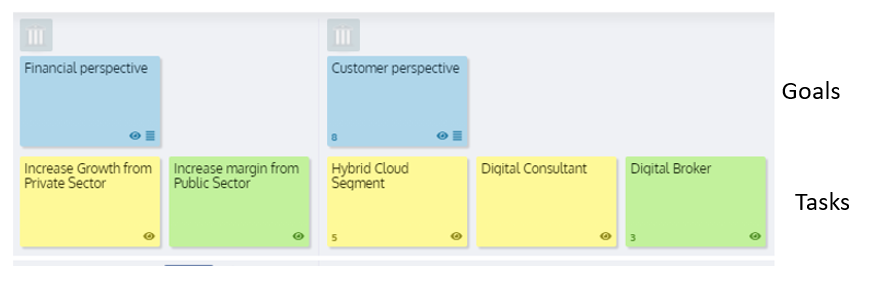
Fig 2 – Story Map translation of Strategy map of BIT
As the Story Map must be available to all employees (on site and working remotely), Paul has utilized a tool already in used in BIT: Storyonboard.
Fig 3 shows how Paul has customized the workflow of the story map of BIT as specified in the ISO 9001 procedure (I will dedicate a post on this topic). This will help to filter the projects based on their status.
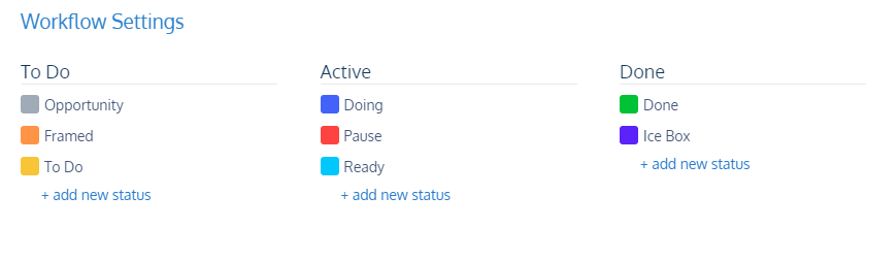 Fig 3 – Workflow of the Strategy Map of BIT
To further facilitate the filter of the projects, Paul has customized the persona of Storyonboard to identify the sponsor of each project (Fig 4). 
Fig 4 – Personas represents the sponsor of each project.
The Persona “Company Balanced Scorecard” is utilized to identify projects that involves several functions.
Always to facilitate the “reading” of the story map through the use of filters, Paul has added the annotation “in track”, “to be checked” and “out of track” (Fig 5). 
Fig 5 – Card Annotations of the Strategy Map of BIT.
Paul is now ready to introduce all active projects of BIT (Fig 6).
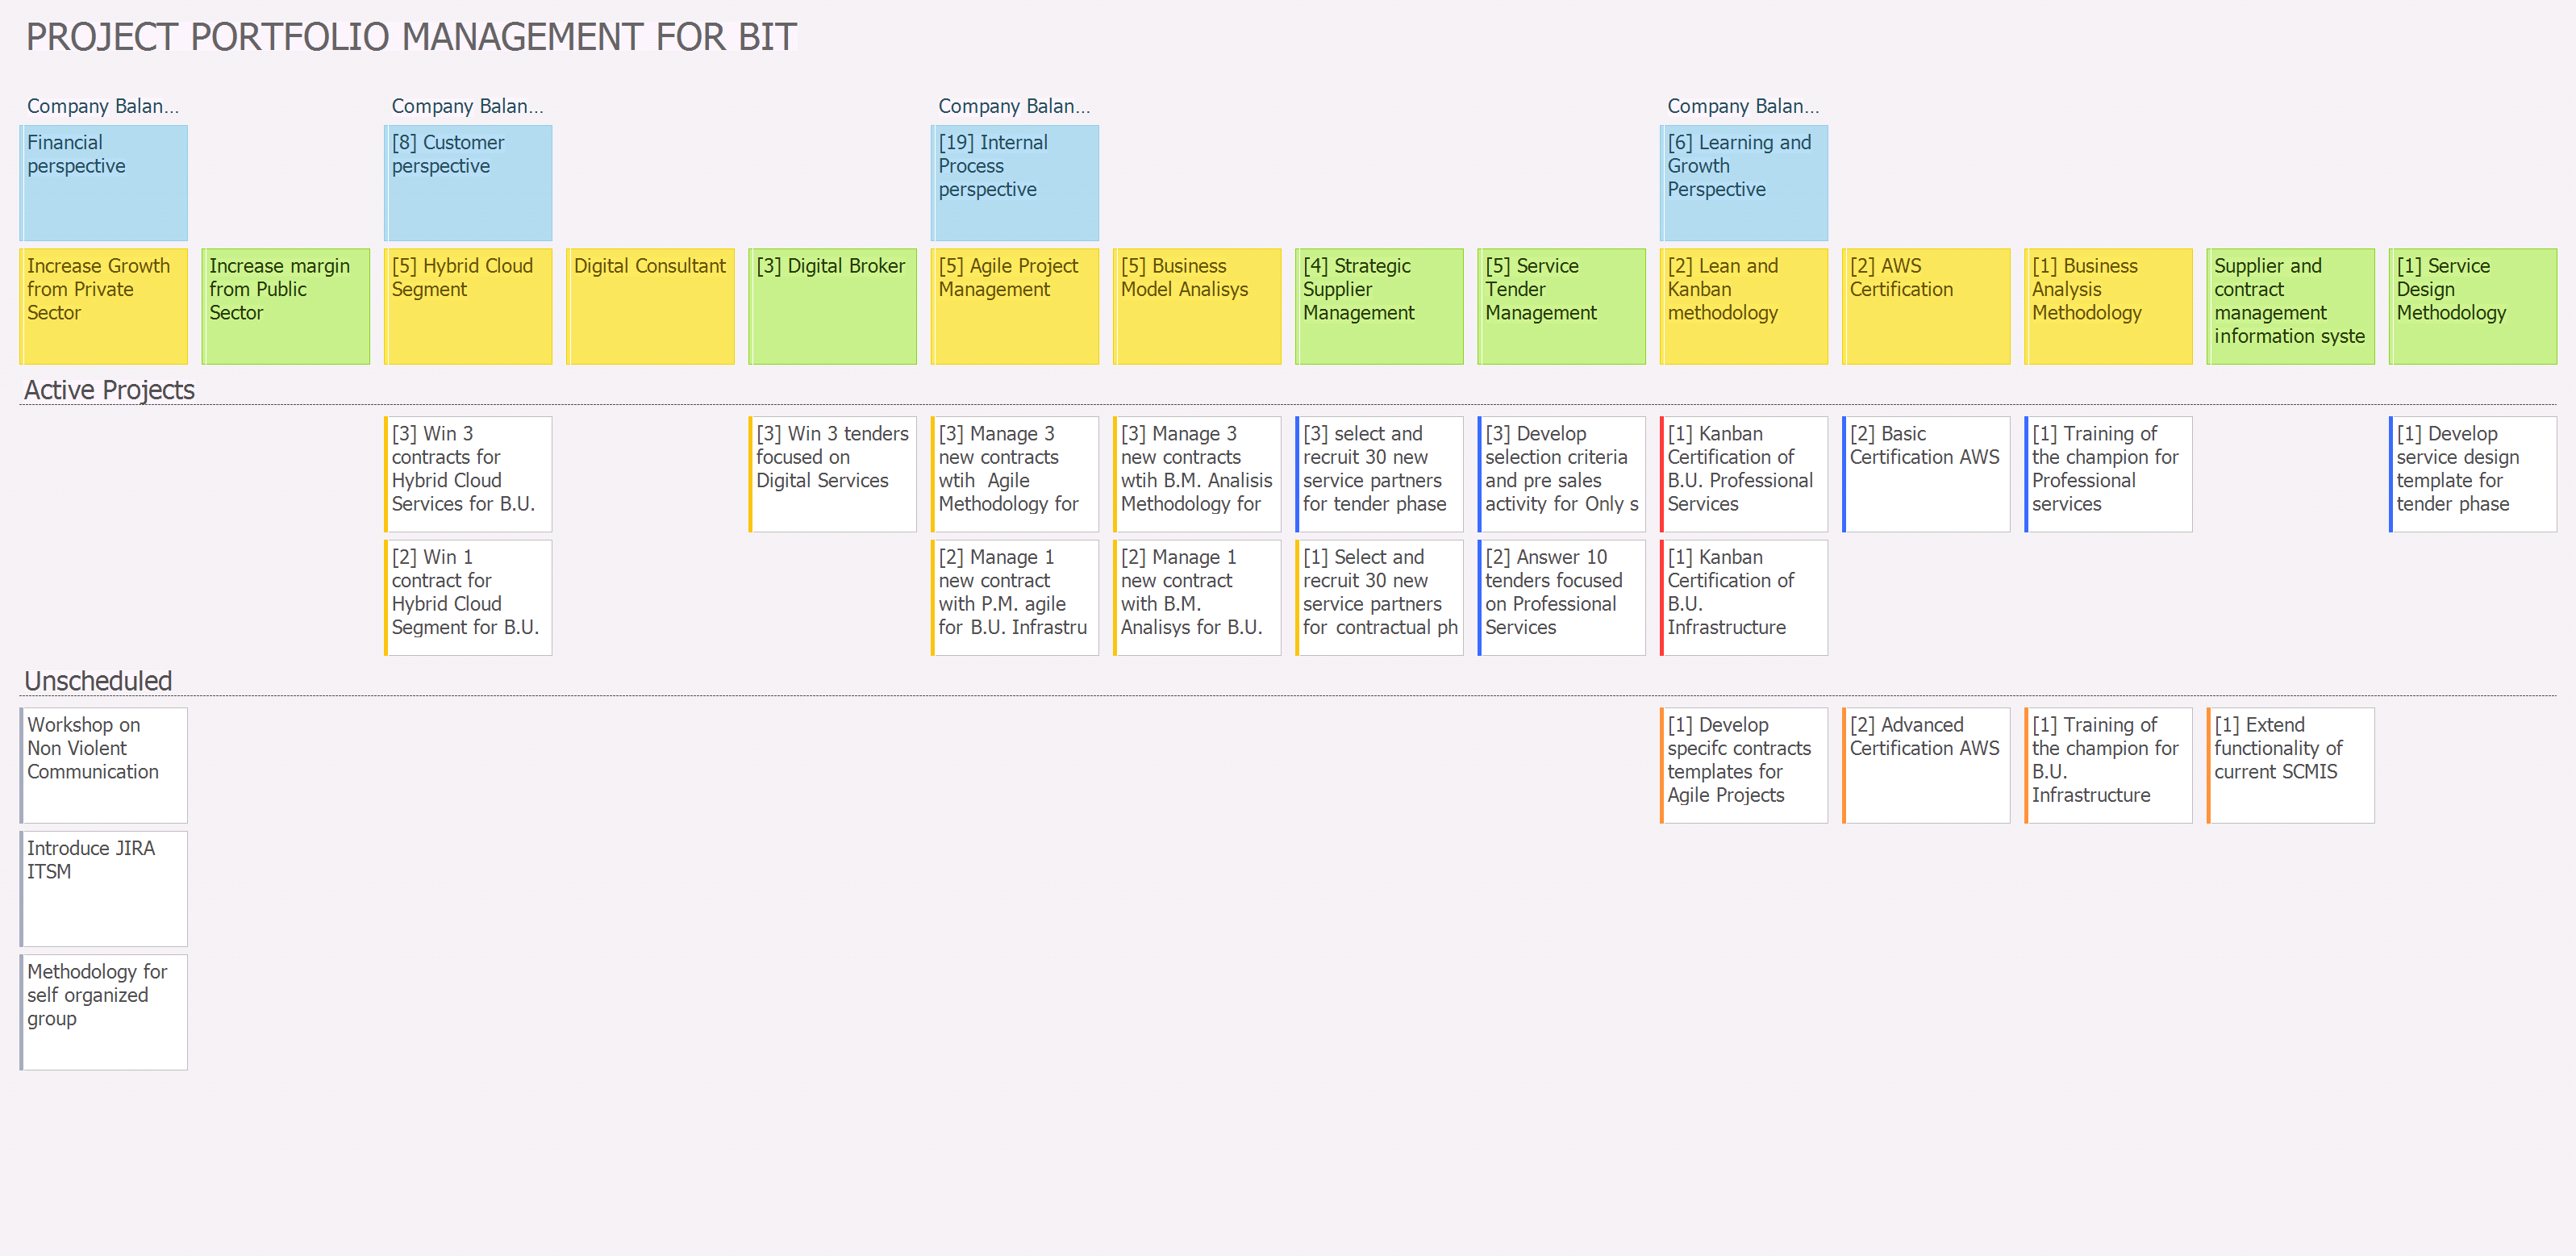
Fig 6 – Project portfolio management of BIT as a Story Map.
In this way, each project becomes a detail of the Strategic Story of BIT.
What to report in each card.
Paul believes that the Story Map methodology would help BIT to articulate the Strategy map through the details of the projects (the card). In other words, the projects should communicate the details of the story of the strategy of BIT through the whole of the cards (the projects).
Each sponsor of the story is free to build and tell the story of his project but to have then a common understanding, a minimum structure of the card (Fig 7).

Fig 7 – Example of content of a card.
The estimation of the project is expressed in points. An extensive training has been performed to acquaintance each function to express the size of the project using points. Each unit has chosen one or two projects that they had employed about 100K euro resources (Capex + Opex). Then, they took other five projects in which they were actively involved and asked them to give a relative size using the Fibonacci series (some of the functions were already familiar with this way to relatively estimate the size of a project). They found quite amusing to employ the planning poker technique for this evaluation.
A second, fundamental, element, is the estimation of the length of the project (expressed in years).
The estimation reported in the card is just the relative size of the project / length of the project.
Every quarter, Finance annotates in the card if the project is in track, to be checked or out of track. The annotation is based on a simple logic:
– A) the consumed resources of the project (ex. 40K) is divided by 100K (i.e.: 0.4).
– B) the time consumed (in months) since the project entered in the status “To Do” (ex 6 month) is divided by 12 (i.e.: 0.5);
– if B-15% <= A <= B +15% the card is annotated “in track”;
– if B -25% <= A <= B +15% the card is annotated “to be checked”;
– if B -40% <= A <= B +40% the card is annotated “out of track”;
Active Projects.
Storyonboard allows to introduce releases in the story. Paul introduced only one and call it Active Project.
The release Active Project allows to see immediately the total points of the projects that have been activated (in this example 33) and with one click it is possible to have the split of the points for status of the card (Fig 8).
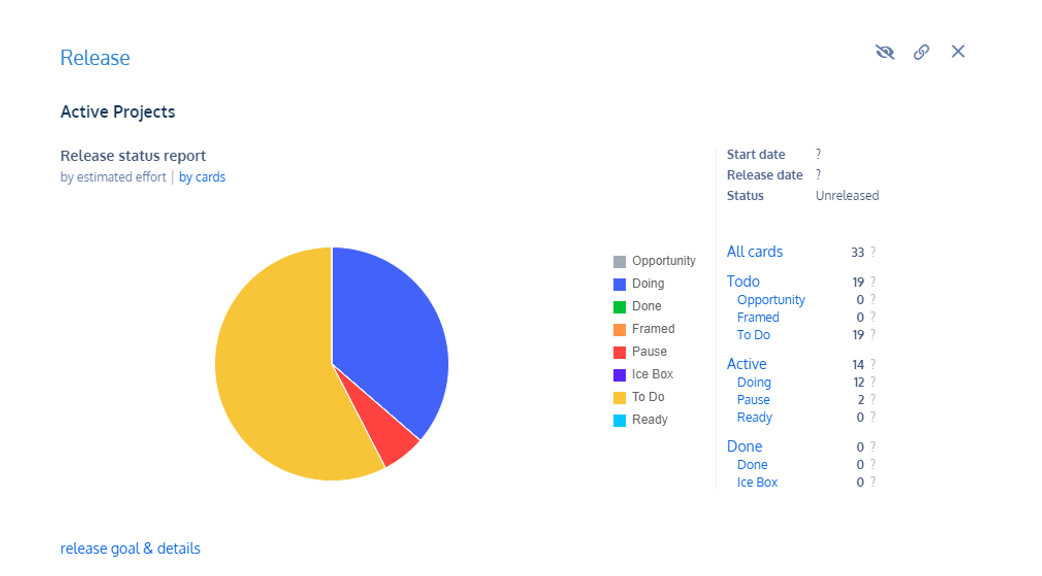
Fig 8 – Split by status of the points of the active projects.
Just clicking one sector of the pie (ex. TO Do), it is then possible to identify all the projects in that status (Fig 9).

Fig 9 – Projects in status Framed.
For the current year, BIT has decided to invest a maximus of 40% of the previous year EBT for change projects. In euro, for the current year there is a possibility to invest max. 3.120K euro. In BIT, this corresponds to a max. of thirty-one points.

